1、 背景
相关提案:KEP61: Real Load Aware Scheduling.
源码地址:Trimaran: Real Load Aware Scheduling
当前 Kubernetes 原生基于 Pod Request 和节点 Allocatable 的调度逻辑无法真实反映集群节点的真实负载情况,因此此调度器插件将节点真实负载情况考虑进了 Pod 调度逻辑中。 该插件的核心组件 Load Watcher 来自 paypal 公司的开源项目。Load Watcher 组件负责从 Prometheus、SignalFx、Kubernetes Metrics Server 等数据源收集集群范围内的实际资源使用量数据(包括 CPU、内存使用量、网络 IO、磁盘 IO 使用量)。
2、实现原理
Load-aware 调度器插件通过 Load Watcher 组件收集的集群实际资源使用量数据,记录集群中的每个节点的真实资源使用量,在调度打分阶段根据节点的真实负载进行打分,让 Pod 调度到合适的节点上。 其中,Load-aware 调度器包含了两种打分扩展插件(Score Plugin):LoadVariationRiskBalancing 和 Targetloadpacking。
a、 LoadVariationRiskBalancing
负载风险均衡器,综合考虑节点的资源(支持 CPU 和内存)平均使用量和使用量变化率,计算出负载风险(risk),最终体现在调度器的打分(score)插件中,影响着每个节点在调度时的分数权重。 负载风险(risk)的计算方式如下:
risk = [ average + margin * stDev^{1/sensitivity} ] / 2
计算得到的负载风险越大,分数越低,最终节点分数计算方式如下:
score = maxScore * (1 - worstRisk)
调度器插件配置样例:
apiVersion: kubescheduler.config.k8s.io/v1beta1
kind: KubeSchedulerConfiguration
leaderElection:
  leaderElect: false
profiles:
- schedulerName: trimaran
  plugins:
    score:
      enabled:
       - name: LoadVariationRiskBalancing
  pluginConfig:
  - name: LoadVariationRiskBalancing
    args:
      safeVarianceMargin: 1
      safeVarianceSensitivity: 2
      metricProvider:
        type: Prometheus
        address: http://prometheus-k8s.monitoring.svc.cluster.local:9090
b、 Targetloadpacking
基于目标负载的打分调度算法:
- 配置
targetUtilization参数指定 CPU 的目标使用百分比(默认为40) - 配置
defaultRequests参数指定容器的 CPU 默认 requests 期望值(当 Pod 没有设置 requests 和 limits 时使用,默认1核) - 配置
defaultRequestsMultiplier参数指定容器的 CPU requests 值的超卖系数(当 Pod 只设置了 requests 没有设置 limits 时使用,默认1.5) - nodeCPUUtilMillis 为通过 Load Watcher 组件收集的节点 CPU 真实使用量
- nodeCPUCapMillis 为节点总 CPU 大小
- missingCPUUtilMillis 为节点
最终节点分数计算方式如下:
// 当 Pod 没有设置 requests 和 limits 时
predictedCPUUsage = ( defaultRequests + nodeCPUUtilMillis ) * 100 / nodeCPUCapMillis

// 当 Pod 只设置了 requests 没有设置 limits 时
predictedCPUUsage = ( ( defaultRequestsMultiplier * pod requests) + nodeCPUUtilMillis ) * 100 / nodeCPUCapMillis

// 分数计算
score = ( 100 - targetUtilization) * predictedCPUUsage / targetUtilization + targetUtilization
调度器插件配置样例:
apiVersion: kubescheduler.config.k8s.io/v1beta1
kind: KubeSchedulerConfiguration
leaderElection:
  leaderElect: false
profiles:
- schedulerName: trimaran
  plugins:
    score:
      disabled:
      - name: NodeResourcesBalancedAllocation
      - name: NodeResourcesLeastAllocated
      enabled:
       - name: TargetLoadPacking
  pluginConfig:
  - name: TargetLoadPacking
    args:
      defaultRequests:
        cpu: "2000m"
      defaultRequestsMultiplier: "2"
      targetUtilization: 70
      metricProvider:
        type: Prometheus
        address: http://prometheus-k8s.monitoring.svc.cluster.local:9090
3、使用手册
其中,调度器插件使用的 Load Watcher 组件有两种部署方式:
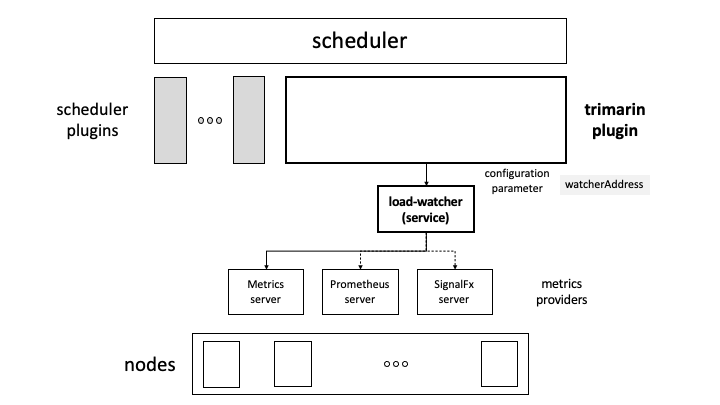
a、通过单独部署第三方 Load Watcher 的方式
使用这种方式,需要在集群中单独部署 Load Watcher 组件,并通过 Service 将服务暴露,配置在调度器插件的 watcherAddress 配置项中,例如:
watcherAddress: http://xxxx.svc.cluster.local:2020/
部署架构:
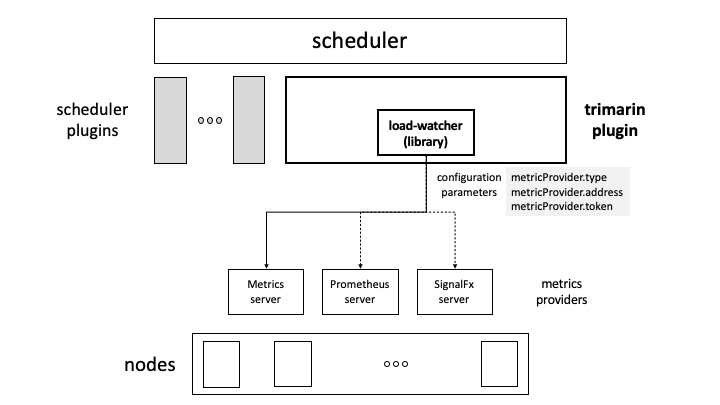
b、通过内置 Load Watcher 的方式
使用这种方式,调度器插件内嵌了 Load Watcher 组件逻辑,只需要在调度器插件的配置中配置数据源相关信息即可,例如:
apiVersion: kubescheduler.config.k8s.io/v1beta1
kind: KubeSchedulerConfiguration
leaderElection:
  leaderElect: false
profiles:
- schedulerName: trimaran
  plugins:
    score:
      enabled:
       - name: LoadVariationRiskBalancing
  pluginConfig:
  - name: LoadVariationRiskBalancing
    args:
      metricProvider:
        type: Prometheus
        address: http://prometheus-k8s.monitoring.svc.cluster.local:9090
      safeVarianceMargin: 1
      safeVarianceSensitivity: 2
以上配置了数据源类型为 Prometheus、数据源地址为 http://prometheus-k8s.monitoring.svc.cluster.local:9090。
部署架构: