1. Related background
As the scale of a single K8s cluster continues to expand (the number of nodes reaches 4,000+), we found during the operation that the apiserver has gradually become the performance bottleneck of the cluster, prone to problems such as unresponsive requests, slow responses, and request rejections, and even causes cluster avalanches, causing Network failure found. The following details how to quickly locate and troubleshoot apiserver performance issues.
2. Reason classification
High load leads to slow access
apiserver high load
- Memory: Generally because there are many List requests and resources, the serialization overhead is also relatively large.
-CPU: When qps or List requests are high, serialization and deserialization overhead will be larger
- Traffic: A large number of List requests lead to large traffic (the source can be confirmed through monitoring and auditing)
etcd high load
-
Traffic: Generally due to the client initiating a large number of List requests and not using the apiserver cache (that is, no ResourceVersion is specified)
-
Memory: Generally due to large traffic
-
CPU: The traffic is relatively large/there are many watchers, etc.
-
IO delay: CBS is abnormally jittering, mother machine load is high, etc.
-
Slow query: The client has more List operations/write requests with full resources
High client load
- High load on client CPU/memory/bandwidth, slow request initiation and receipt of return packets
引发限速
apiserver speed limit
-
Inflight speed limit (confirmed by monitoring the indicator apiserver_current_inflight_requests): apiserver default speed limit is 200 for writing (–max-mutating-requests-inflight) and 400 for reading (–max-requests-inflight).
-
1.20+ APF speed limit (Confirmed by monitoring indicators apiserver_flowcontrol_rejected_requests_total, apiserver_flowcontrol_request_execution_seconds_bucket): APF speed limit is enabled by default in 1.20 , the default speed limit will be through namespace, user, etc. The default speed limit threshold of user and system components (kcm, scheduler, etc.) under kube-system is higher, and the speed limit threshold of ordinary serviceaccount is lower. It may be triggered when the apiserver response is slow. , the phenomenon may be strange (for example, some components or serviceaccount token requests are slow or unresponsive).
-
Loopback client speed limit, low version (1.12 and below) apiserver will request itself (qps 50) through loopback client. When using serviceaccount authentication to access kube-apiserver, if the concurrency is too high, it may cause speed limit (at this time in the apiserver log A large number of Create tokenreviews (30s slow query) are common), refer to the fried rice guy: Case analysis of apiserver avalanche caused by a ServiceAccount
Client speed limit
- The default qps of client-go is 5, the default of kcm is 20, and the default of scheduler is 50: If the rate limit is triggered, the log level is 4 or above (the log level of high version client-go is above 3). You can see the Throttling request took related information in the client log. log
###External component exception
-
The webhook responds slowly when performing authentication and authorization through webhook
-
The admission webhook responds slowly: the api-server log will print Call xxx webhook related words, such as: Call Audit Events webhook

3. Troubleshooting method
Observe APIServer monitoring
-
Check whether the machine’s CPU, memory, load, and traffic monitoring are abnormal
-
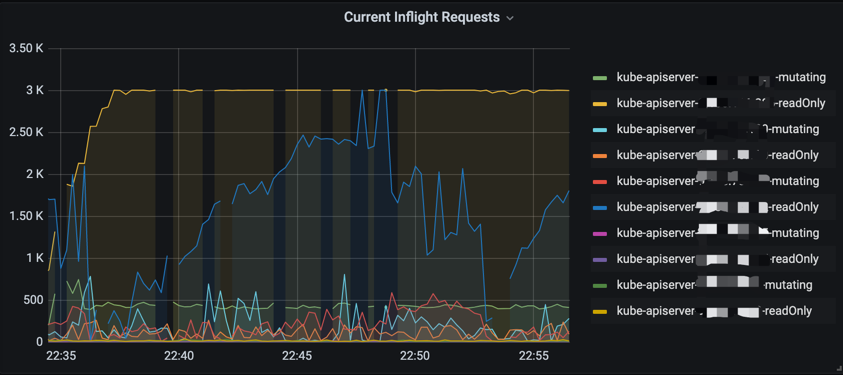
Inflight related indicators, the default speed limit is 200 for writing (–max-mutating-requests-inflight) and 400 for reading (–max-requests-inflight). Observe whether the monitoring view reaches the speed limit threshold (maintains at a fixed value, and the view is a horizontal line). If the speed limit threshold is reached, it is usually because the client has a large number of abnormal requests/the server responds slowly. You can combine apiserver qps monitoring and delay monitoring to locate specific abnormal requests. If the cluster is large, you can confirm whether the inflight speed limit is reasonable (no adjustment is generally required for nodes below 1,000, and inflight for large clusters is adjusted to 1,000, and 3,000 is generally sufficient).
PromQL:
sum(apiserver_current_inflight_requests{cluster_id=~“xxx”}) by (requestKind,pod_name)
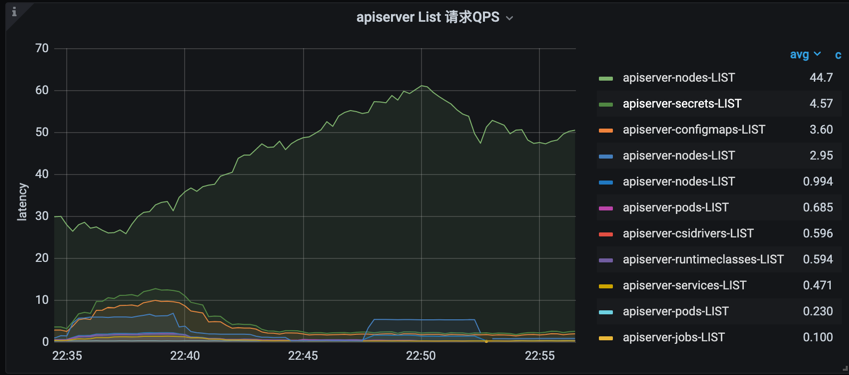
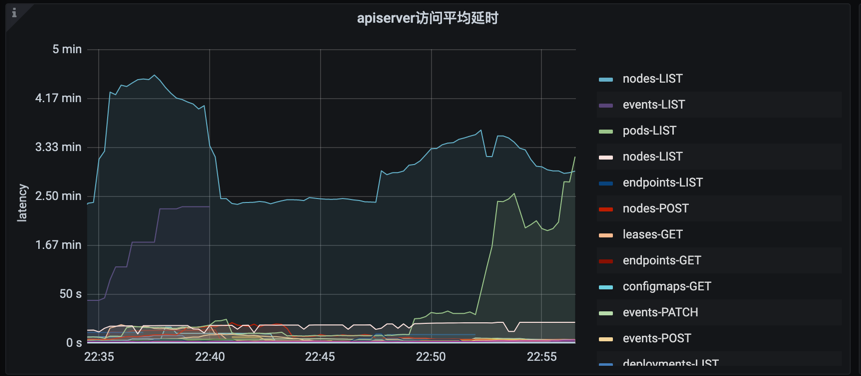
- list request qps
PromQL:
topk(10, sum(rate(apiserver_request_count{cluster_id=“xxx”, verb=“LIST”}[5m])) by (component, client, resource,verb,scope)) or topk(10, sum(rate(apiserver_request_total{cluster_id=“xxx”, verb=“LIST”}[5m])) by (component, client, resource,verb,scope))
- number of resource objects
PromQL:
topk(15, sum by (clusterId,etcdPrefix,resourceName) (kstone_monitor_etcd_key_total{clusterId=“xxx”}))
- apiserver request delay
PromQL:
sum(rate (apiserver_request_latencies_summary_sum{cluster_id=“xxx”, verb=~“GET|LIST|POST|PUT|DELETE|PATCH”}[5m])) by (resource, verb) / sum(rate (apiserver_request_latencies_summary_count{cluster_id=“xxx”, verb=~“GET|LIST|POST|PUT|DELETE|PATCH”}[5m])) by (resource, verb)/ 1000 / 300 > 0
avg(apiserver_request_duration_seconds_sum{cluster_id=“xxx”, verb=~“GET|LIST|POST|PUT|DELETE|PATCH”} / apiserver_request_duration_seconds_count{cluster_id=“xxx”, verb=~“GET|LIST|POST|PUT|DELETE|PATCH”}) by (resource, verb)
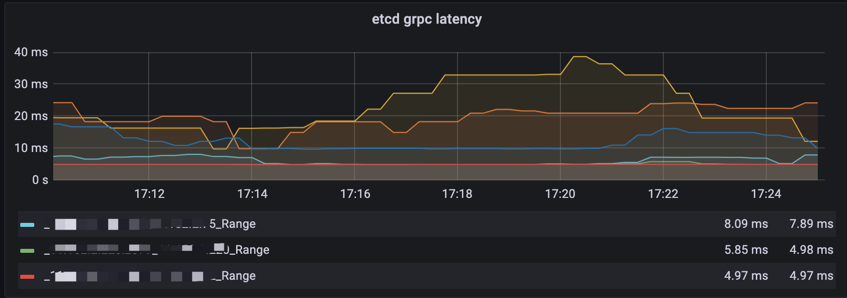
- etcd request delay webhook request delay etc
PromQL:
histogram_quantile(0.99, sum(rate(grpc_server_handling_seconds_bucket{cluster_id=“xxx”, grpc_method=~“Range|Txn”}[5m]) > 0) by (remark,instance,le,grpc_method,endpoint))
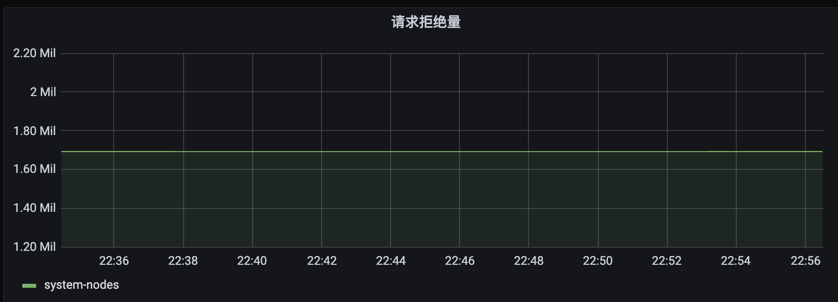
For clusters of versions 1.20 and above, observe whether the APF speed limit is reached, mainly observing the request waiting time and the number of rejected requests.
PromQL:
request concurrency limit:sum by (node, priority_level) apiserver_flowcontrol_request_concurrency_limit{cluster_id=“xxx”}
request waiting time P99:histogram_quantile(0.99, sum by (flow_schema, priority_level, le) (apiserver_flowcontrol_request_wait_duration_seconds_bucket{cluster_id=“xxx”}))
request execution time P99:histogram_quantile(0.99, sum by (flow_schema, priority_level, le) (apiserver_flowcontrol_request_execution_seconds_bucket{cluster_id=“xxx”}))
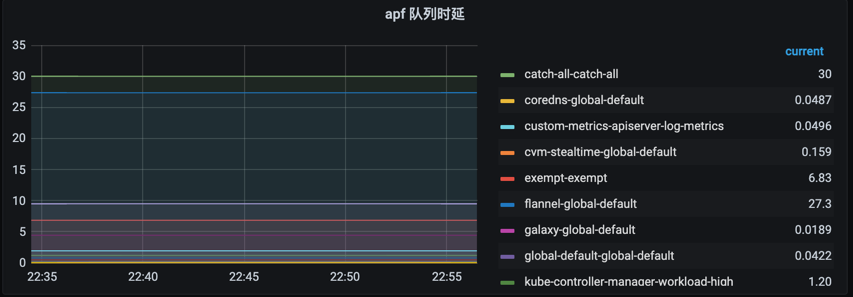
PromQL:
sum(apiserver_flowcontrol_rejected_requests_total{cluster_id=“xxx”})by (flow_schema)