1. Background
Related proposals: KEP61: Real Load Aware Scheduling.
Source code address: Trimaran: Real Load Aware Scheduling
The current Kubernetes native scheduling logic based on Pod Request and node Allocatable cannot truly reflect the real load of cluster nodes, so this scheduler plug-in takes the real load of nodes into the Pod scheduling logic. The core component of this plug-in Load Watcher comes from the open source project of paypal company. The Load Watcher component is responsible for collecting cluster-wide actual resource usage data (including CPU, memory usage, network IO, disk IO usage) from data sources such as Prometheus, SignalFx, Kubernetes Metrics Server, etc.
2. Implementation principle
The Load-aware scheduler plug-in collects the actual resource usage data of the cluster through the Load Watcher component, records the actual resource usage of each node in the cluster, and scores according to the actual load of the node during the scheduling and scoring stage, so that the Pod can be scheduled to the appropriate location. on the node. Among them, the Load-aware scheduler includes two scoring extension plug-ins (Score Plugin): LoadVariationRiskBalancing and Targetloadpacking.
a. LoadVariationRiskBalancing
The load risk balancer takes into account the average usage and usage change rate of the node’s resources (supporting CPU and memory) to calculate the load risk (risk), which is ultimately reflected in the scheduler’s score plug-in, affecting each The fractional weight of the node in scheduling. Load risk (risk) is calculated as follows:
risk = [ average + margin * stDev^{1/sensitivity} ] / 2
The greater the calculated load risk, the lower the score. The final node score is calculated as follows:
score = maxScore * (1 - worstRisk)
Scheduler plug-in configuration example:
apiVersion: kubescheduler.config.k8s.io/v1beta1
kind: KubeSchedulerConfiguration
leaderElection:
  leaderElect: false
profiles:
- schedulerName: trimaran
  plugins:
    score:
      enabled:
       - name: LoadVariationRiskBalancing
  pluginConfig:
  - name: LoadVariationRiskBalancing
    args:
      safeVarianceMargin: 1
      safeVarianceSensitivity: 2
      metricProvider:
        type: Prometheus
        address: http://prometheus-k8s.monitoring.svc.cluster.local:9090
b. Targetloadpacking
Scoring scheduling algorithm based on target load:
- Configure the
targetUtilizationparameter to specify the target usage percentage of the CPU (default is 40) - Configure the
defaultRequestsparameter to specify the container’s CPU default requests expectations (used when Pod does not set requests and limits, defaults to 1 core) - Configure the
defaultRequestsMultiplierparameter to specify the oversold coefficient of the container’s CPU requests value (used when the Pod only sets requests but does not set limits, defaults to 1.5) - nodeCPUUtilMillis is the real node CPU usage collected through the Load Watcher component
- nodeCPUCapMillis is the total CPU size of the node
- missingCPUUtilMillis for node
The final node score is calculated as follows:
// When Pod does not set requests and limits
predictedCPUUsage = (defaultRequests + nodeCPUUtilMillis) * 100 / nodeCPUCapMillis

// When the Pod only sets requests but does not set limits
predictedCPUUsage = ( ( defaultRequestsMultiplier * pod requests) + nodeCPUUtilMillis ) * 100 / nodeCPUCapMillis

// score calculation
score = ( 100 - targetUtilization) * predictedCPUUsage / targetUtilization + targetUtilization
Scheduler plugin configuration example:
apiVersion: kubescheduler.config.k8s.io/v1beta1
kind: KubeSchedulerConfiguration
leaderElection:
  leaderElect: false
profiles:
- schedulerName: trimaran
  plugins:
    score:
      disabled:
      - name: NodeResourcesBalancedAllocation
      - name: NodeResourcesLeastAllocated
      enabled:
       - name: TargetLoadPacking
  pluginConfig:
  - name: TargetLoadPacking
    args:
      defaultRequests:
        cpu: "2000m"
      defaultRequestsMultiplier: "2"
      targetUtilization: 70
      metricProvider:
        type: Prometheus
        address: http://prometheus-k8s.monitoring.svc.cluster.local:9090
3. User Manual
Among them, the Load Watcher component used by the scheduler plug-in has two deployment methods:
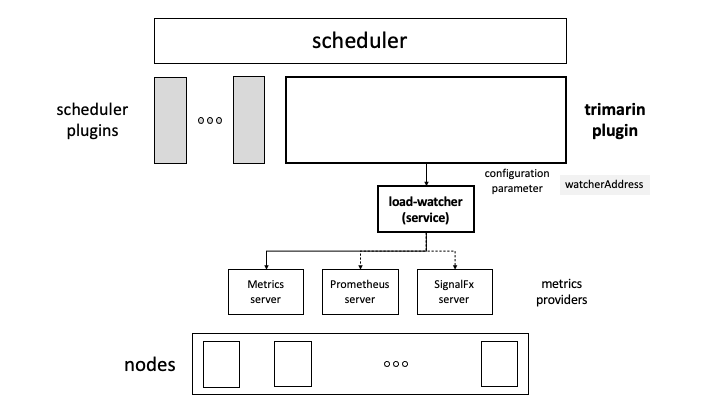
a. By separately deploying a third-party Load Watcher
To use this method, you need to deploy the Load Watcher component separately in the cluster, expose the service through Service, and configure it in the watcherAddress configuration item of the scheduler plug-in, for example:
watcherAddress: http://xxxx.svc.cluster.local:2020/
Deployment architecture:
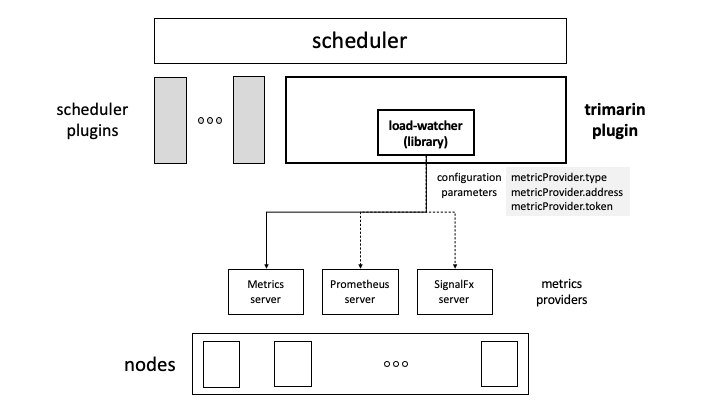
b. Through built-in Load Watcher
Using this method, the scheduler plug-in embeds the Load Watcher component logic, and you only need to configure the data source related information in the configuration of the scheduler plug-in, for example:
apiVersion: kubescheduler.config.k8s.io/v1beta1
kind: KubeSchedulerConfiguration
leaderElection:
  leaderElect: false
profiles:
- schedulerName: trimaran
  plugins:
    score:
      enabled:
       - name: LoadVariationRiskBalancing
  pluginConfig:
  - name: LoadVariationRiskBalancing
    args:
      metricProvider:
        type: Prometheus
        address: http://prometheus-k8s.monitoring.svc.cluster.local:9090
      safeVarianceMargin: 1
      safeVarianceSensitivity: 2
The above configuration configures the data source type as Prometheus and the data source address as http://prometheus-k8s.monitoring.svc.cluster.local:9090.
Deployment architecture: