1. Background
Recently, business Pod scheduling failures often occur online. Looking at the cluster monitoring, the resources of the cluster are indeed relatively tight, but there are still some nodes with sufficient resources. For example, the request value of the business Pod is set to:
resources:
  limits:
    cpu: "36"
    memory: 100Gi
  requests:
    cpu: "18"
    memory: 10Gi
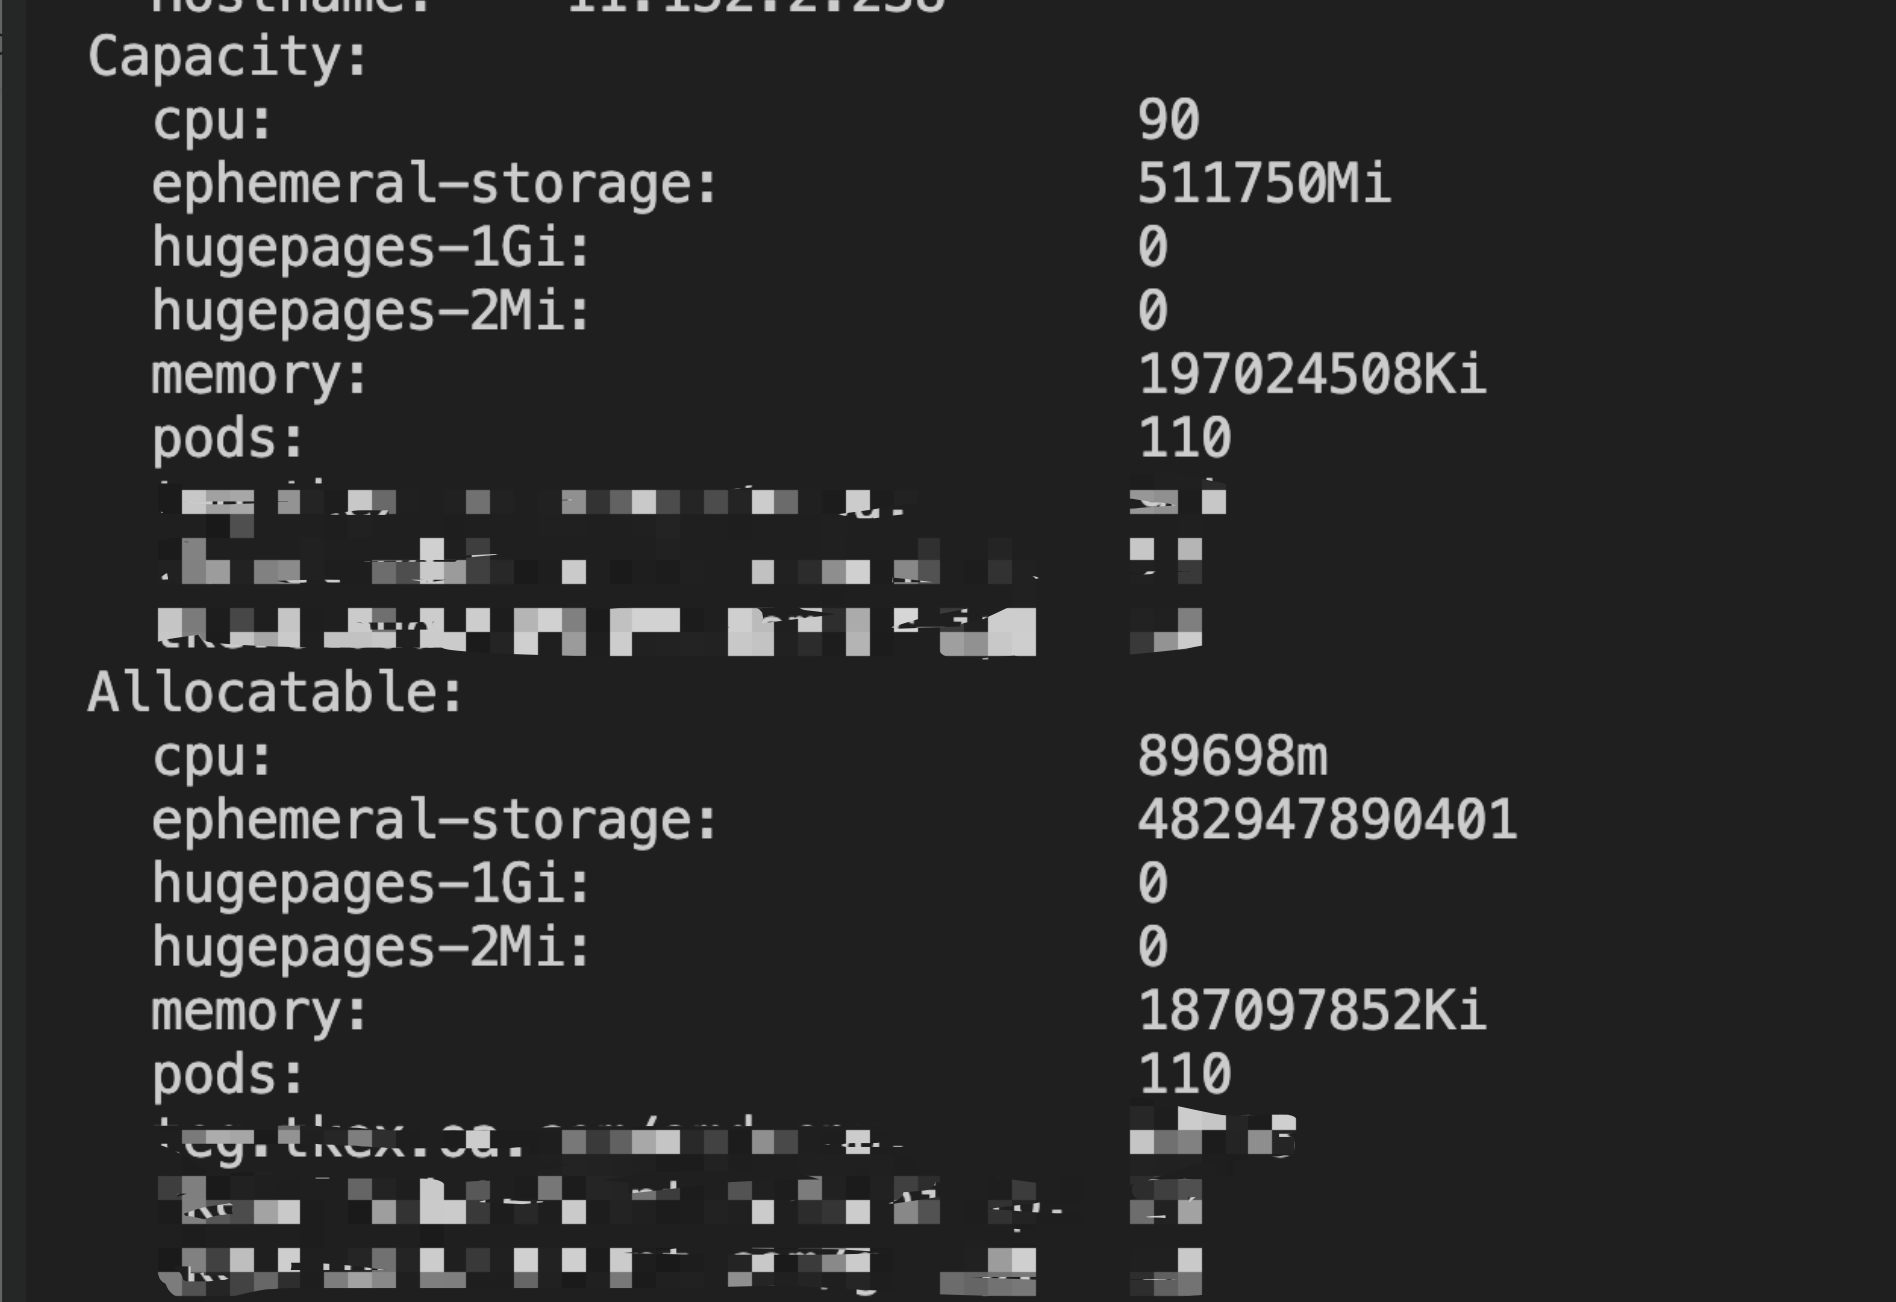
There are nodes with idle resources in the cluster:
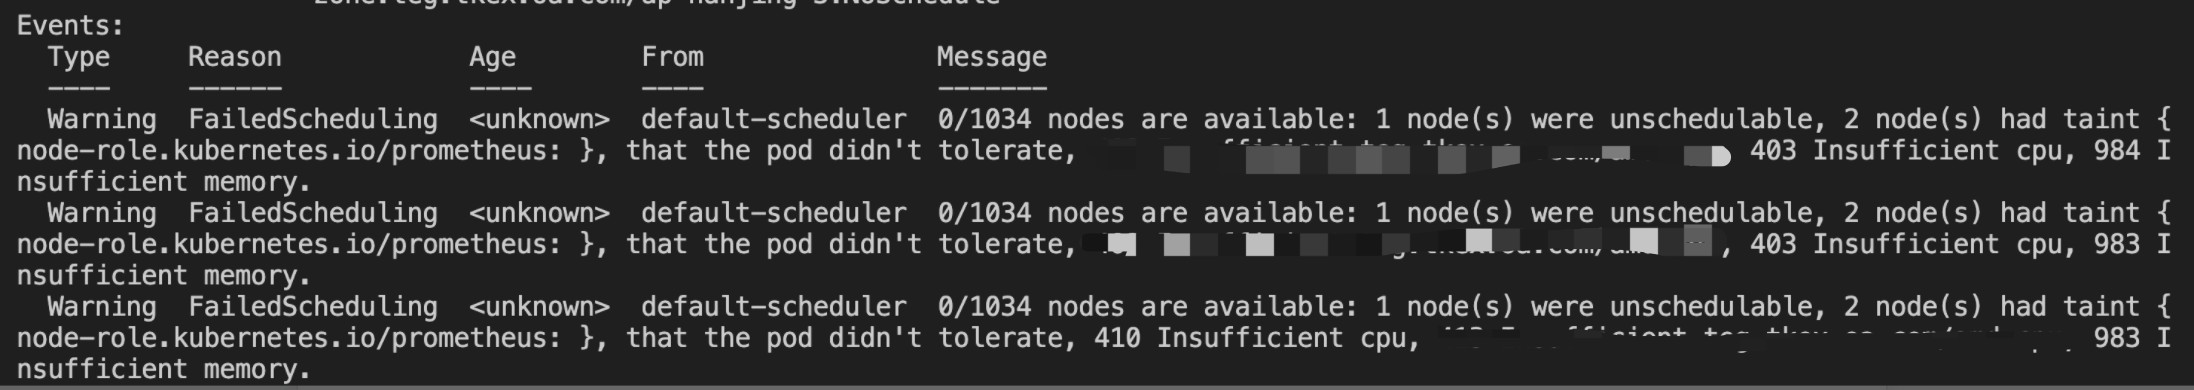
Pod Event reported that there are not enough resources to schedule:
2. Analysis of scheduling process
During the scheduler scheduling process, the scheduler’s NodeResources pre-selection algorithm will calculate whether the requests value of the Pod to be scheduled meets the node’s schedulable resources (allocatable). If not, the node will be filtered out and an insufficient xxx event will be printed.
*** pkg/scheduler/framework/plugins/noderesources/fit.go ***
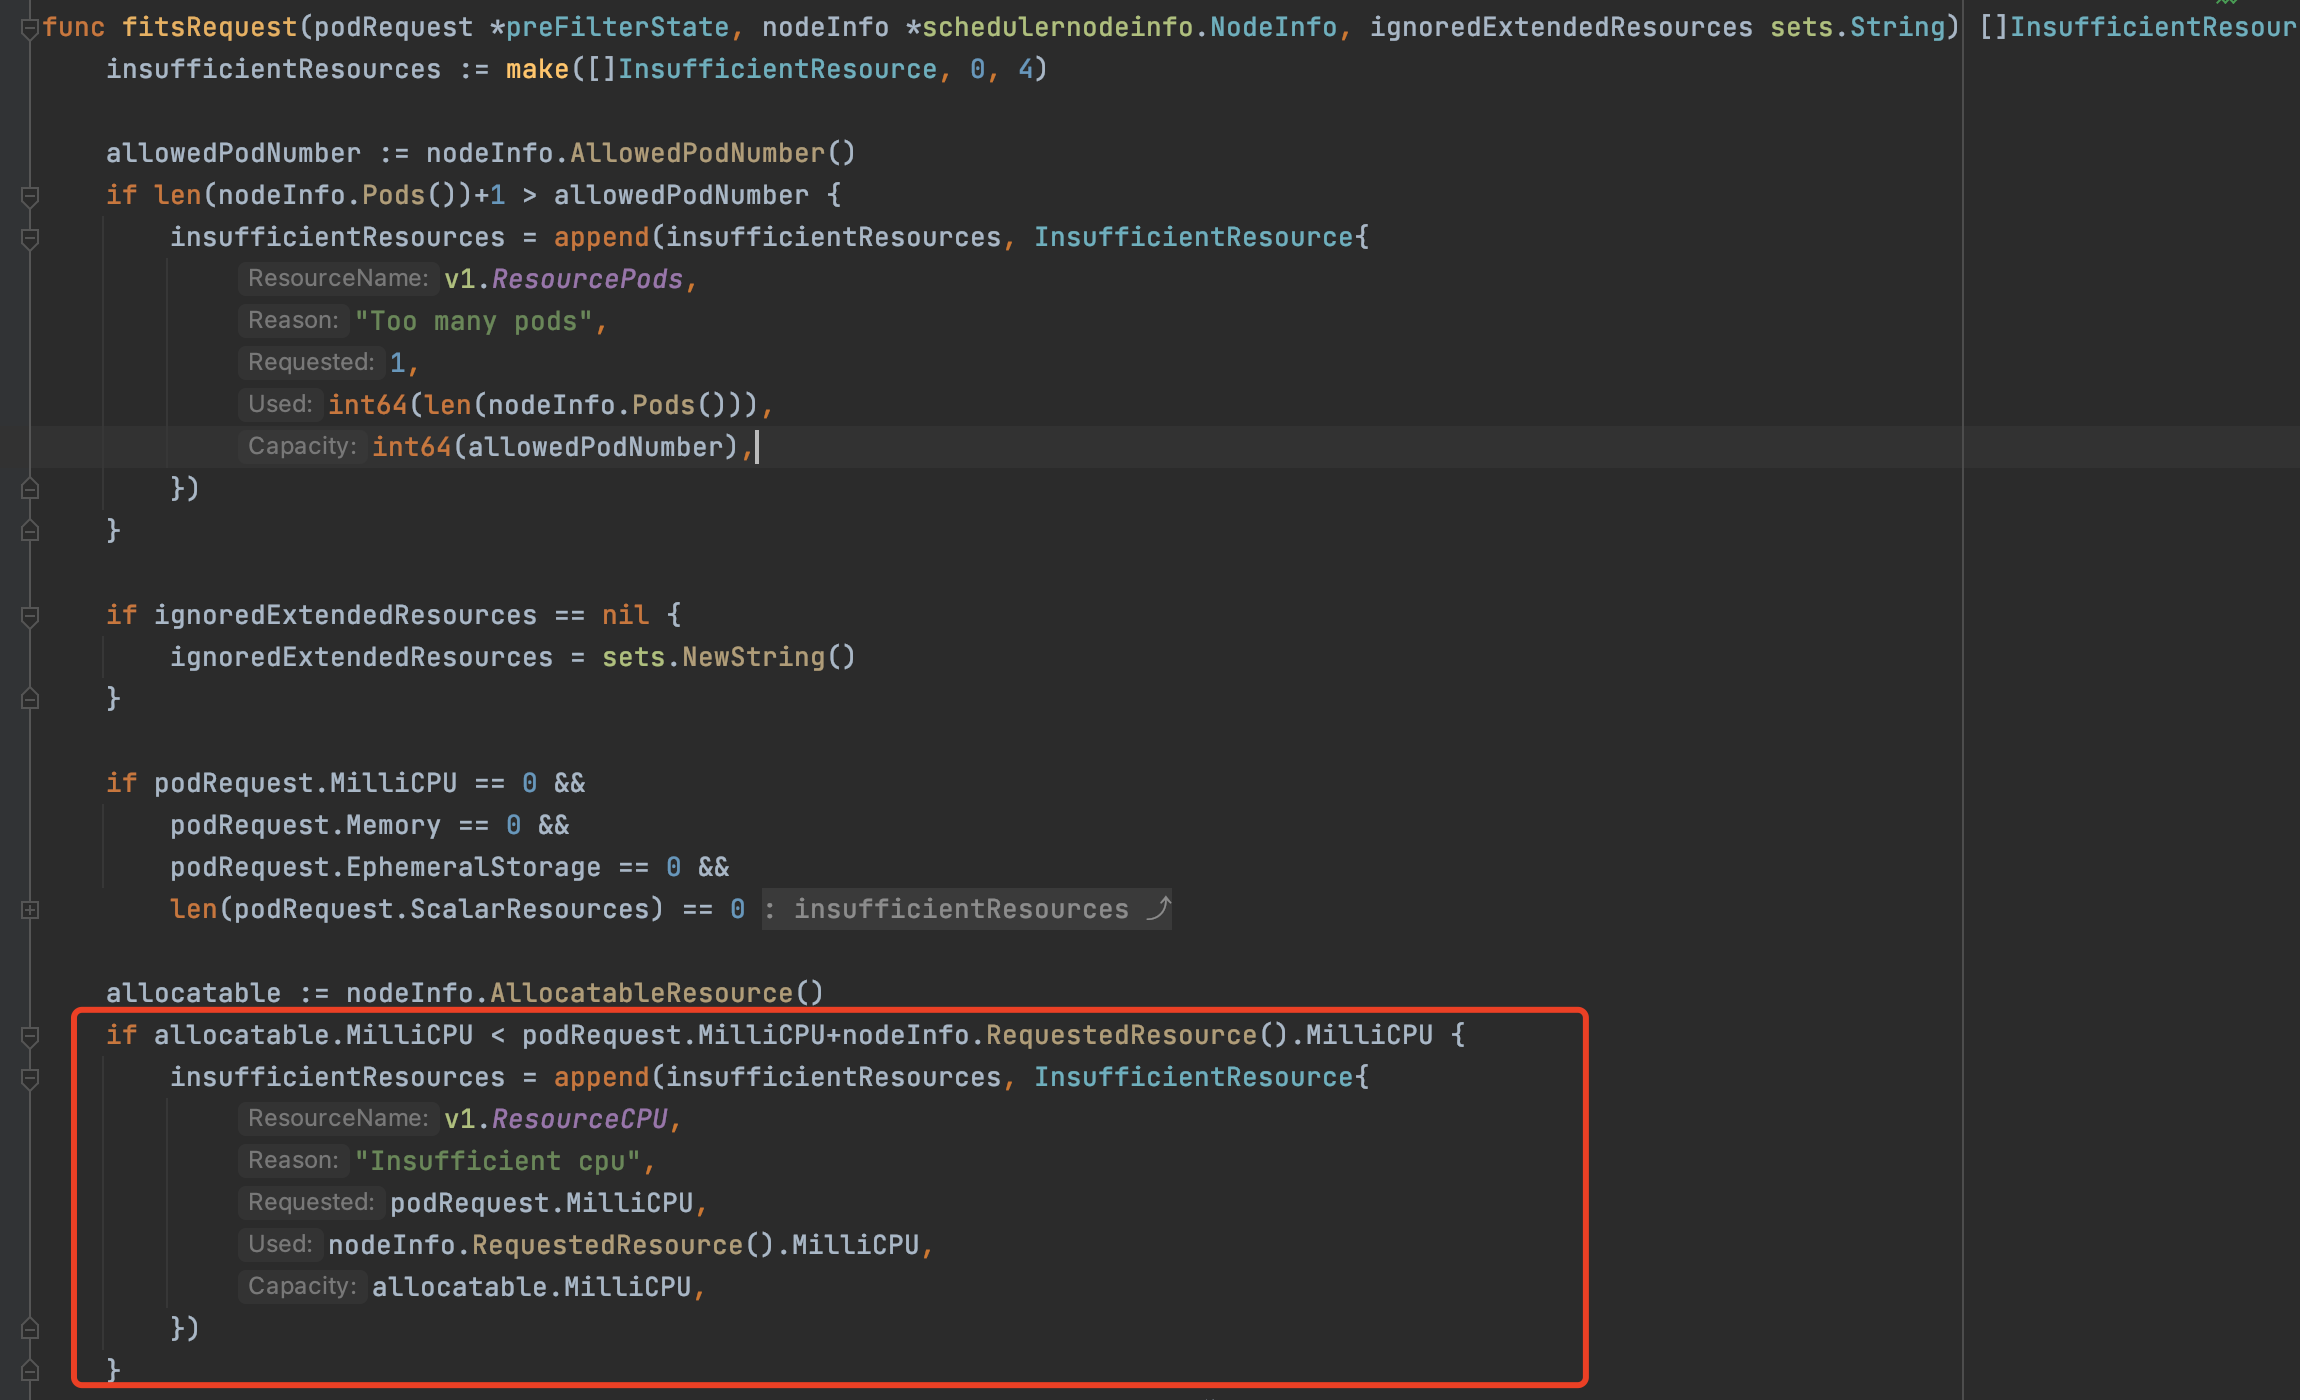
In the code above, the allocatable schedulable resources of the node are taken from the nodeInfo object. Intuitively, nodeInfo should be consistent with the information we see using kubectl describe <node name>. There are nodes with idle resources in the node.
The insufficient xxx event of insufficient resources should not be printed out during the NodeResources pre-selection phase.
After analyzing the scheduler source code, we found that nodeInfo not only counts the allocatable value of the current node, the scheduler will take out the Pod from the Nominated queue and add it to the podList of nodeInfo for subsequent resource calculations.
*** pkg/scheduler/core/generic_scheduler.go ***
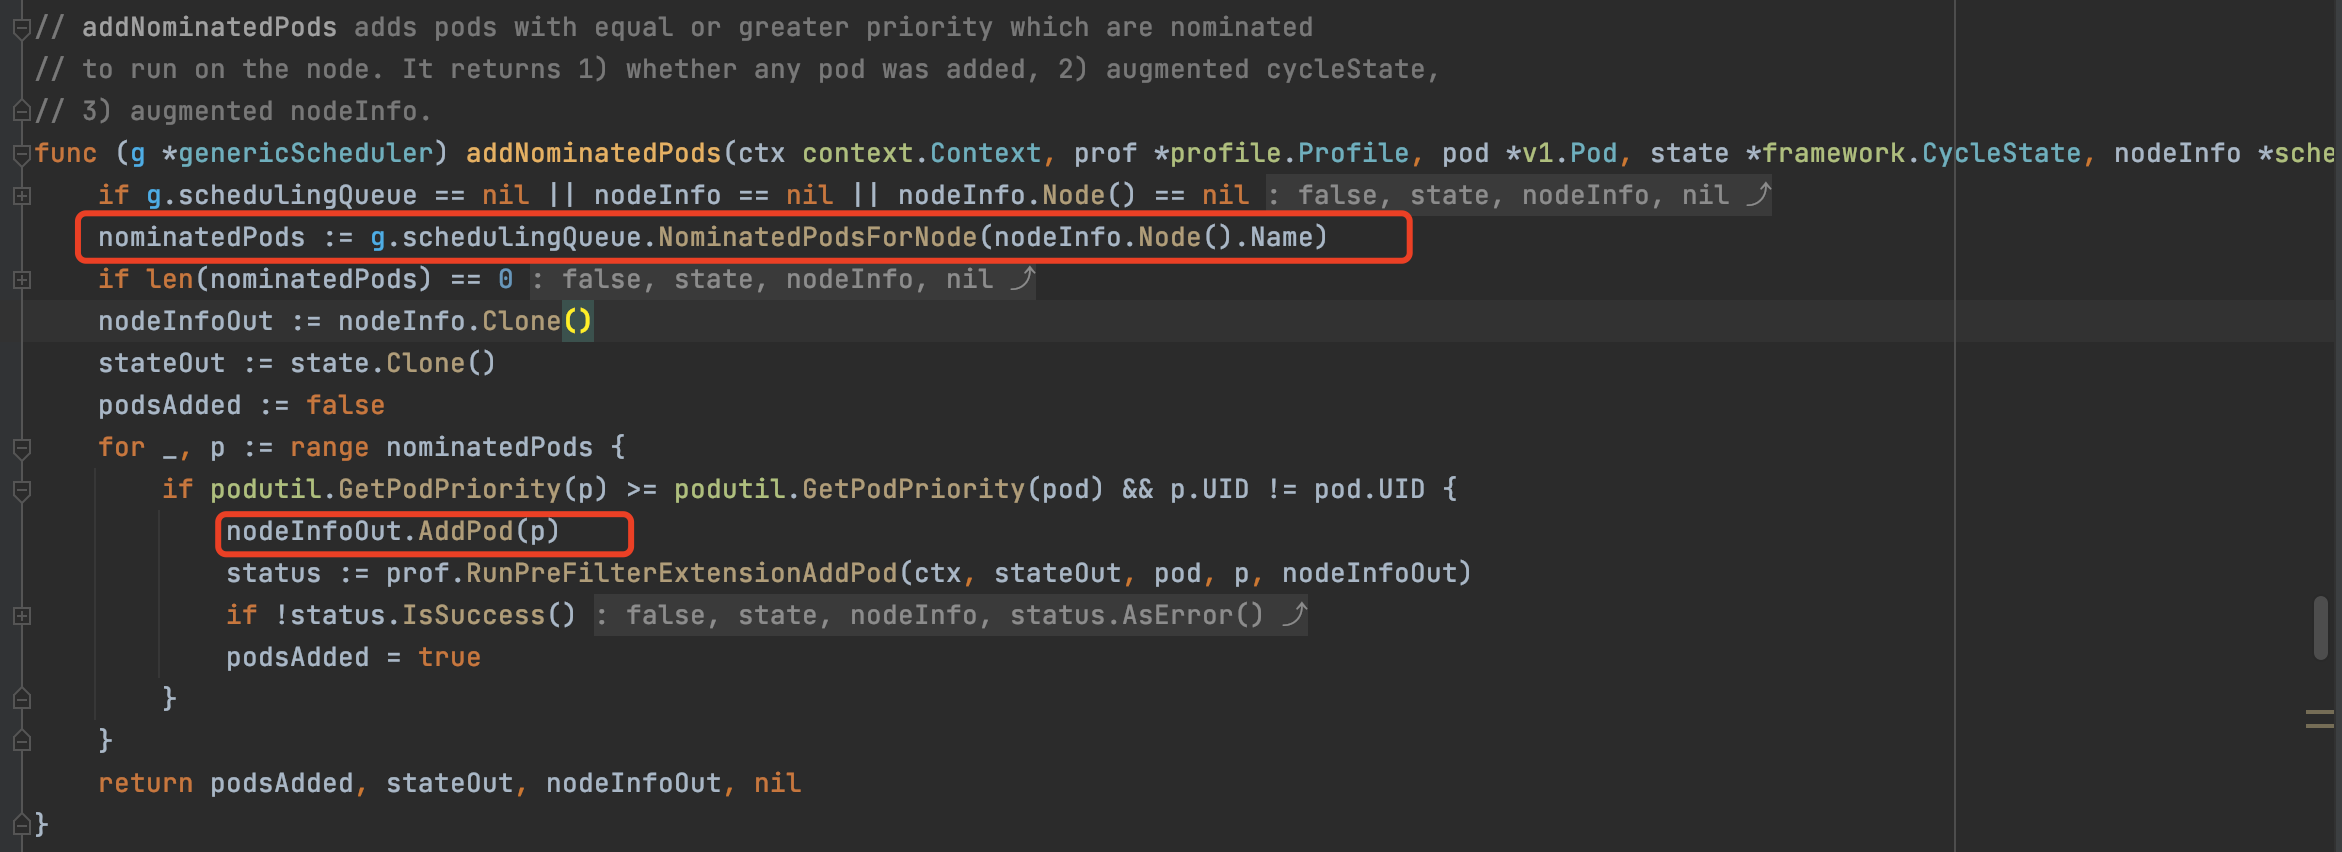
Therefore, when scheduling, not only the allocatable value of the node must be considered, but also whether there is a Pod’s nominated Node bound to the node:
# kubectl get pod -A -owide | grep 10.123.2.135 | grep -i pending
test-ns test-pods-rjqngl     0/1   Pending    0  15d   <none>  <none>  10.123.2.135  1/1
test-ns test-pods-retbgf     0/1   Pending    0  15d   <none>  <none>  10.123.2.135  1/1
The nominated Node of a Pod in the cluster is bound to an idle node. As a result, the node has insufficient resources during scheduling and cannot pass the NodeResources preselection algorithm. At the same time, because the Pod PriorityClass in the cluster has the same priority, the new Pod cannot preempt the old nominated Pod, and eventually the scheduling fails. After we raised the priority of the new Pod, we found that these idle nodes in the cluster were being utilized.
3. Conclusion
Pods in the Nominated state are often ignored by us. When scheduling, the scheduler not only considers the current allocatable value of the node, but also considers the node to which the node is bound. The resources occupied by Nominated Pod. When analyzing the problem of Pod scheduling failure, I would like to share some very practical commands to facilitate troubleshooting:
Dynamically adjust scheduler log level
- Log in to the host or pod where the scheduler is located
- Execute the following command to set the log level, for example, set it to level “4”
- After collecting the required logs, run the same command to set the log level to 2
$ curl -X PUT http://localhost:10251/debug/flags/v -d "4"
scheduler log export
-
Find the scheduler master node through the endpoint of kube-scheduler, and then use ps -ef | grep scheuduler to find the pid of the scheduler
-
Send the SIGUSR2 signal to the kube-scheduler process, which will dump cache and queue information in the log. kill -SIGUSR2
-
Then docker inspect xxx | grep log to find the log file location of the scheduler.
-
How to find the node cache information of the dump (node allocatable quota, used requests value, bound Pod list): 1. Search for “Dump of cached NodeInfo” in the log, 2. Search for “Node Name: <node name” in the log >"
-
How to find the dump of Pending Pod information: Search for “Dump of scheduling queue” in the log