一、Introduction to HPA
HPA (Horizontal Pod Autoscaler) Pod automatically scales up and down. K8S realizes dynamic addition and reduction of the number of Pod instances by detecting various indicators of the containers running in the Pod (CPU usage, memory usage, network requests).
Early Kubernetes versions only supported the detection of CPU indicators because it was implemented through Heapster, the monitoring system that comes with Kubernetes.
After kubernetes version 1.8, heapster has been deprecated, and resource indicators are mainly obtained through the metrics api. At this time, more indicators can be supported for detection (core indicators such as CPU and memory, and custom indicators such as qps). *)
2. HPA settings
HPA is a resource object, configured through yaml:
apiVersion: autoscaling/v2beta1
kind: HorizontalPodAutoscaler
metadata:
  name: podinfo
spec:
  scaleTargetRef:
    apiVersion: extensions/v1beta1
    kind: Deployment
    name: podinfo
  minReplicas: 2
  maxReplicas: 10
  metrics:
  - type: Resource
    resource:
      name: cpu
      targetAverageUtilization: 80
  - type: Resource
    resource:
      name: memory
      targetAverageValue: 200Mi
  - type: Pods
    pods:
      metric:
        name: packets-per-second
      target:
        type: AverageValue
        averageValue: 1k
  - type: Object
    object:
      metric:
        name: requests-per-second
      describedObject:
        apiVersion: networking.k8s.io/v1beta1
        kind: Ingress
        name: main-route
      target:
        type: Value
        value: 10k
minReplicas: Minimum number of pod instances
maxReplicas: Maximum number of pod instances
metrics: List of metrics used to calculate the required number of Pod replicas
resource: Core indicators, including CPU and memory (indicators defined in the requests and limits of the container in the pod object being elastically scaled.)
object: Specific indicators of k8s built-in objects (you need to implement the adapter yourself)
pods: Application specific indicators of pod objects that are elastically scaled (for example, the number of transactions processed by each pod per second) (you need to implement the adapter yourself)
external: Custom indicators for non-k8s built-in objects (you need to implement the adapter yourself)
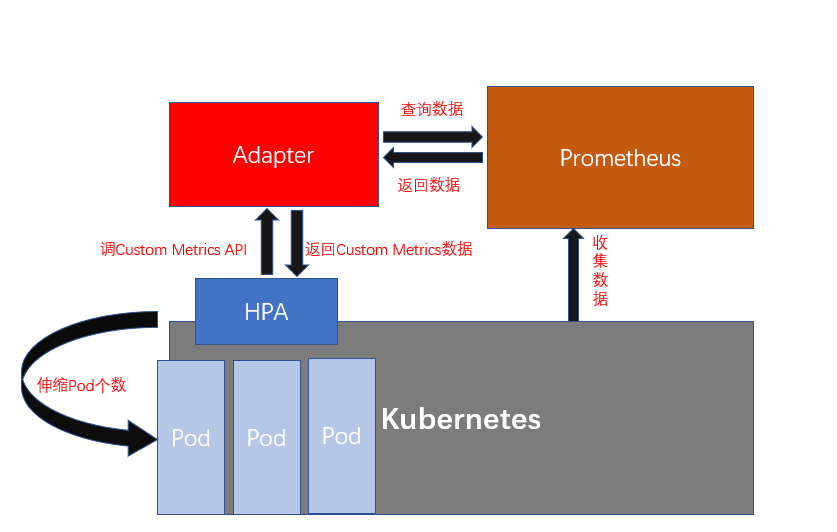
三、HPA obtains the underlying implementation of Custom Metrics (based on Prometheus)
Kubernetes uses the Agrregator APIServer extension mechanism to implement Custom Metrics. Custom Metrics APIServer is an API service (an adapter for Prometheus) that provides querying Metrics indicators. After this service is started, kubernetes will expose an API called custom.metrics.k8s.io. When this URL is requested, the request goes through Custom Metics APIServer Go to Prometheus to query the corresponding indicators, and then return the query results in a specific format.
For specific steps, please refer to: https://github.com/resouer/kubeadm-workshop (The yaml files for creating Custom Metrics APIServer, Prometheus and HPA samples are in the demos/monitoring directory)
HPA sample configuration:
kind: HorizontalPodAutoscaler
apiVersion: autoscaling/v2beta1
metadata:
  name: sample-metrics-app-hpa
spec:
  scaleTargetRef:
    apiVersion: apps/v1
    kind: Deployment
    name: sample-metrics-app
  minReplicas: 2
  maxReplicas: 10
  metrics:
  - type: Object
    object:
      target:
        kind: Service
        name: sample-metrics-app
      metricName: http_requests
      targetValue: 100
After HPA is configured, HPA will send https request to Custom Metrics APIServer:
https://<apiserver_ip>/apis/custom-metrics.metrics.k8s.io/v1beta1/namespaces/default/services/sample-metrics-app/http_requests
It can be known from the above https request URL path that this is a request to obtain the http_requests indicator sent to the service named sample-metrics-app under the default namespaces.
After receiving the http_requests query request, Custom Metrics APIServer sends a query request to Prometheus to query the value of http_requests_total (total number of requests). Custom Metrics APIServer then calculates the result into http_requests (request per unit time) rate) is returned to enable HPA to obtain performance indicators to perform elastic scaling operations.
The indicator acquisition process is shown in the figure below:
How to customize the Adapter’s indicators: https://github.com/DirectXMan12/k8s-prometheus-adapter
Helm’s way of customizing Adapter’s indicators: https://github.com/helm/charts/blob/master/stable/prometheus-adapter/README.md